How to simplify the science of big data analytics
We dedicated to make advanced big data analytics more accessible and approachable, while allowing people to discover actioanable insights in mintues or hours.
Download the full White Paper!
A challenge is presented when customers, products, and environments change, and the traditional analytics tools of taxonomies and ontological maps must evolve. Another challenge is specialized skills of data scientists are required to update the tools. These updates need to be specifically identified and implemented, resulting in time delays in responding to changes in the data. Fortunately, this complex process of analytics can now be simplified using Machine Learning.
Machine Learning algorithms learn by example. They do so automatically and will generalize data based on what is learned (i.e. inductive learning). Generalization is a critical component is determining how well Machine Learning performs and includes: Finding natural groupings within a data set; Classifying categories in which data points belong
Forecasting and Regression analysis;Determining the most important variables that affect outcomes
Machine Learning is not a new concept, however, cloud computing is making it more accessible and affordable than ever before. Compute power and storage is plentiful in the cloud, and it includes the ability to scale capacity in minutes to handle large data jobs. You no longer need to maintain your own processing and storage infrastructure.
Download the full White Paper!
Inductive learning lies at the heart of Machine Learning. There is no need to have prior knowledge of the data. There is no need to make assumptions in the data set or work with small samples. This method of unsupervised learning removes the potential for bias to be inserted into the analysis and makes identification of unknown issues to surface. Inductive learning lets the data tell its own story. This approach is an even greater asset when there is a large amount of data, and there is little advance knowledge of the story the data tells or the questions to ask.
One of the most difficult and untapped problems in analytics has been unstructured textual data. This problem is an excellent use case for Machine Learning and statistical Natural Language Processing (NLP). Eliminating taxonomical and ontological analytics methods simplifies the process, improves the time to glean insights from data, reduces the operational cost of analytics, and removes inherent biases in a predetermined interpretation framework.
The best results are achieved when the Human Factor is added to Machine Learning. Automation is susceptible to a loss of insights from an experienced human analyst. Harmonizing human decisions with machine learning is key to unlocking insights through analytics. An Augmented Intelligence approach can leverage both human and machine learning, and analytics efforts are best served when harmonizing the two. The famous chess battles with IBM’s Deep Blue chess-playing machine are examples.
Chess master Gary Kasparov designed a tournament to determine which grouping would garner superior results – solely humans, solely computers, or a combination of humans and computers. Teams comprised of humans leveraging computer assistance consistently defeated all challengers including the strongest “computer only” and “human only” teams. A surprising finding, however, unfolded and was reported by Kasparov. “The winner was revealed to be not a grandmaster with a state-of-the-art computer, but a pair of amateur American chess players using three computers at the same time.”
Combining the speed and processing power of a computer with a human’s interpretive capabilities leads to superior results. This is Augmented Intelligence in its basic form - computational algorithms helping to put the human end user in the best position to make an informed decision. Algorithms read and analyze data to show the “who”, “what”, “when” and “where”. A human then uses this intelligence to determine the “why” and decides on the appropriate course of actionable Insights.
Let the data tell the story through visualization:
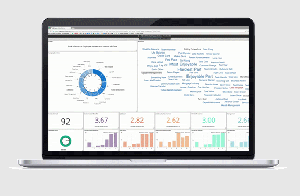
People generally don’t want to consume content in the form of long spreadsheets of numbers or text. Insights are simplified when the results are easy to understand, leaping off the page in the form of graphics and charts, color coded, and easy to digest. Additional layers of content can be made available by clicking, or hovering over specific visuals to see additional information. Comparison of data sets side by side, comparisons over time periods, and comparison ranking simplify the story. The key is to help business teams quickly spot key trends, patterns, and themes so they can better anticipate and refine strategies and best practices in real-time.
An interactive UI allows virtually anyone to interact with data, empowering many in an enterprise to consumer analytics. Interactive visualizations assist with one of the most fundamental concepts in investigative analysis, the four W’s (who, what, when, where). Visualizations depict each of the four W’s, while the human analysts build their own conclusions on the “why”. Most importantly, by augmenting intelligence through deep computing processes, the “why” can be turned into specific action.
Collaborative analytics.
Usability is further simplified and enhanced when visualizations are customized, annotated, and shared with colleagues. Collaboration on analytics benefits users in many ways:
Speeds the time from data to revenue, using social interaction to speed decision-making.
Opens communication, identification of insights, and the creation of action plans helps align business strategies. This keeps everyone on the same page.
Enables companies to extend the analysis to a greater portion of the enterprise so timely and useful insights can be added by other team members.
Increases information visibility across the company.
Improves organizational cohesion.
Simply put, business teams can make better decisions by working collaboratively, rather than working independently and linearly.
The Complexity is Behind the Scenes - How Signals platform works.
Download the full White Paper!
Bella Wei
Stratifyd
4258941671
email us here
Your A.I.-Powered Big Data Analytics Platform
Legal Disclaimer:
EIN Presswire provides this news content "as is" without warranty of any kind. We do not accept any responsibility or liability for the accuracy, content, images, videos, licenses, completeness, legality, or reliability of the information contained in this article. If you have any complaints or copyright issues related to this article, kindly contact the author above.


