
Understanding the relative development of goods and services inflation
Prepared by Catalina Martínez Hernández, Mario Porqueddu, Blanca Prat I Bayarri and Lourdes Maria Zulli Gandur
Published as part of the ECB Economic Bulletin, Issue 2/2025.
The gap between services and non-energy industrial goods (NEIG) inflation varies over time, but it had remained positive for a long period until the 2021-2022 inflation surge (Chart A).[1] Historically, services prices have increased at faster rates than NEIG prices, implying a persistent positive gap between the two inflation rates. The gap in annual inflation rates changed from an average of 1.5 percentage points in the period from 1999 to 2008 to an average of 1.0 percentage points between 2008 and 2019. This narrowing was mainly due to a decrease in services inflation, probably reflecting subdued demand and low wage growth after the financial and sovereign debt crises.[2] During the COVID-19 pandemic, restrictions such as social distancing and widespread lockdown measures affected the relative consumption of goods and services and associated price pressures. By 2022, the rapid and strong increase in NEIG inflation, which outpaced the increase in services inflation, led to a negative gap of more than 1 percentage point, which only reverted to positive territory when goods inflation normalised in 2023 and 2024 in a way that was almost symmetrical to the previous surge. However, while NEIG inflation came down, services inflation remained elevated and has since hovered around 4%. The positive gap has thus widened to an average of 2.5 percentage points in recent quarters.
Chart A
Services and goods inflation and the gap between the two
(annual percentage changes and percentage points)
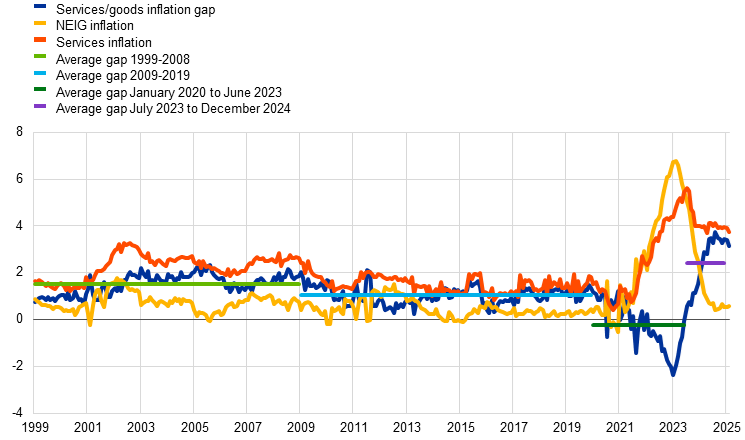
Sources: Eurostat and ECB calculations.
Notes: The services/goods inflation gap is the difference between the annual rates of change in the HICP components for services and NEIG. The latest observations are for February 2025.
The sizeable movements in the inflation gap over recent years largely reflect the stronger impact of energy costs and global supply chains on goods inflation and the dynamics of wages and labour costs. Evidence from a structural Bayesian vector autoregression (BVAR) indicates that supply-side shocks, particularly those related to energy and global supply chains, had a larger and quicker but less persistent effect on NEIG inflation than on services inflation (Chart B).[3] In the latest data, the effects of these shocks have essentially faded away in NEIG inflation, which is currently being held down mainly by weak foreign demand. In contrast, in services inflation the impact of supply shocks has been more persistent and there is continued upward pressure from labour market shocks associated with still strong wage pressures. Looking forward, the moderation in energy prices, the gradual unwinding of supply shocks and lower wage growth are expected to contribute to a slowdown in services inflation.
Chart B
Historical decomposition of services inflation and NEIG inflation
(percentage points and percentage point contributions in deviations from the mean implied by the model and initial conditions)
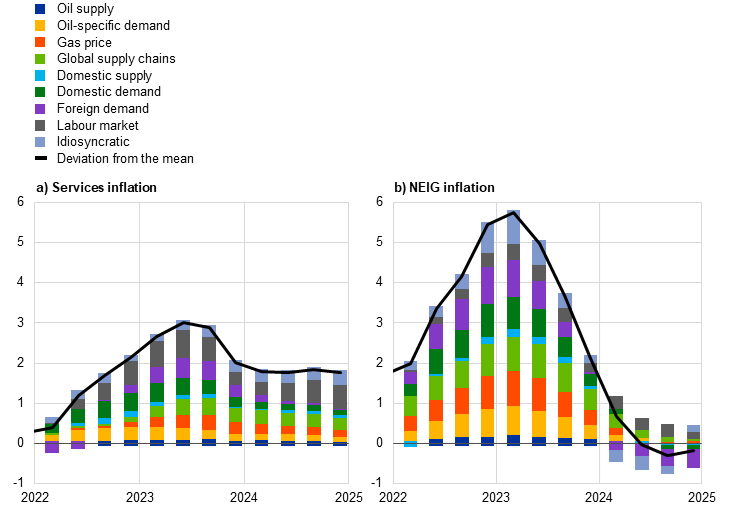
Sources: Eurostat, Haver and ECB calculations.
Notes: The panels show the pointwise mean contribution of structural shocks to services inflation and NEIG inflation in deviation from the impact of initial conditions and the mean. The model is based on a quarterly version of the structural BVAR in Bańbura, M, Bobeica, E. and Martínez Hernández, C., “What drives core inflation? The role of supply shocks”, Working Paper Series, No 2875, ECB, 2023. The estimation sample is from the fourth quarter of 1996 to the fourth quarter of 2024.
The recently strongly positive inflation gap implies that the relative price level of services over goods is converging to the pre-pandemic trend (Chart C). Between 2021 and mid-2023, the relative price level of services over NEIG moved to well below long-term trends. By February 2025 this deviation had grown to around 3.9% below the trend estimated over the period 1999-2019. Relative prices vis-à-vis the trend provide an additional perspective to assessing inflation rates vis-à-vis longer-term inflation averages, as the latter may not be a reliable benchmark for future developments. For instance, the below-target “low inflation” period led to a pre-pandemic longer-term average for core inflation of just 1.6%, while currently available projections see core inflation settling at around 2.0% over the years ahead. Looking at the convergence of the relative price level to trend has the advantage that, in principle, it does not depend on a specific assumption for the core inflation rate. Unless the shocks of past years have led to a permanent shift in preferences and productivity, the relative price level can be expected to converge to its pre-pandemic trend, at least over the medium term. The recent evolution of the gap points to an almost symmetrical unwinding of the build-up to mid-2023.[4]
Chart C
Relative price of services over NEIG
(ratio of price level indices: January 1999 = 1)

Sources: Eurostat and ECB calculations.
Notes: The chart shows price developments in services relative to those for NEIG. The data are seasonally adjusted. The latest observation is for February 2025. Trends are estimated by regressing the logarithm of the relative price level on a constant and a linear trend.
Future trends in relative prices are surrounded by a large degree of uncertainty as these depend on structural factors related to global trends, digitalisation, demographics and climate change. For instance, deglobalisation due to geopolitical and trade fragmentation could push up prices of tradable goods.[5] Digitalisation and developments in artificial intelligence (AI) could affect services and goods prices differently.[6] The size of the overall effect remains uncertain and depends on how quickly these technologies are adopted in the production process. Demographic trends, such as ageing, could lead to stronger demand for services and push up prices by affecting wage costs in the comparatively labour-intensive services sector. Climate change and related mitigation measures could affect goods and services prices to different extents, both via exposure to sector-specific consequences of climate change and via exposure to sector-specific mitigation policies, such as higher carbon taxes as part of the energy transition.[7]
Legal Disclaimer:
EIN Presswire provides this news content "as is" without warranty of any kind. We do not accept any responsibility or liability for the accuracy, content, images, videos, licenses, completeness, legality, or reliability of the information contained in this article. If you have any complaints or copyright issues related to this article, kindly contact the author above.
