Housing investment and the user cost of housing in the euro area
Prepared by Niccolò Battistini and Johannes Gareis
Housing investment in the euro area as a whole has fallen significantly from its post-pandemic peak. Housing investment in the euro area fell by about 4% between the first quarter of 2022 and the fourth quarter of 2023, with a particularly sharp decline in Germany and France, a slight rise in Spain and a significant rise in Italy. The fall in housing investment in the euro area was preceded by a sharp increase in construction costs during the pandemic and a significant rise in long-term risk-free rates from the start of the recent monetary policy tightening cycle at the end of 2021 onwards. The rise in interest rates was also accompanied by a tightening of bank credit standards, which in turn contributed to rising mortgage rates and slowing credit flows. These developments, along with the subsequent decline in house prices, prompted an increase in the implied cost of living for homeowners, as measured by the “user cost of housing”. As mortgage rate rises and house price declines appear to be slowing or even reversing to some extent, the question arises of how housing investment will evolve in the period ahead. To shed light on this issue, this box examines the current level of housing investment in the euro area in relation to a novel measure of the user cost of housing.[1]
The user cost of housing is a fundamental driver of housing investment.[2] The affordability of housing can be measured by the cost of capital invested by a household in its dwelling, i.e. the user cost of housing.[3] This measure corresponds to a homeowner’s opportunity cost of living in a dwelling compared with the utility of consuming other (current or future) goods and services, making it an important determinant of housing investment.[4] The user cost of housing is usually expressed as a percentage of the value of the dwelling and contains both costs and compensating benefits. These include (i) mortgage interest expenses, which measure the debt service cost for financing the dwelling; (ii) foregone income, which gauges unrealised earnings from investing in a non-housing asset; (iii) expected capital gains, reflecting the reduction in costs owing to the expected increase in the value of the house; (iv) the loan-to-value (LTV) ratio, which determines the relative weight of the debt service cost versus foregone income; (v) net taxes, including property taxes as well as tax deductions on debt service and taxes on foregone income; and (vi) other items, including maintenance and repair costs, depreciation and risk premia.[5] Bundling items (iv), (v) and (vi), the user cost of housing increases with higher debt service costs, foregone income, expected capital losses, or (net) tax payments and other expenses, which reduces the amount of investment households might wish to make in owner-occupied housing. In sum, the user cost of housing provides a broad measure of the cost of owning and living in a home and reflects the consumption of housing services that underlies a household’s decision to invest in a home of its own.
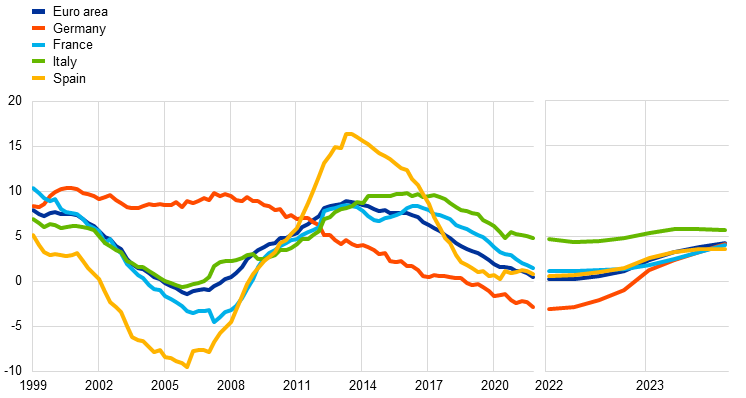
Chart A
User cost of housing across the euro area
(percentages per annum)
Sources: Barrios et al. (op. cit.), Eurostat, ECB and ECB calculations.
Note: The user cost of housing for the euro area represents the weighted average of the national cost measures, using household housing wealth as a weighting factor.
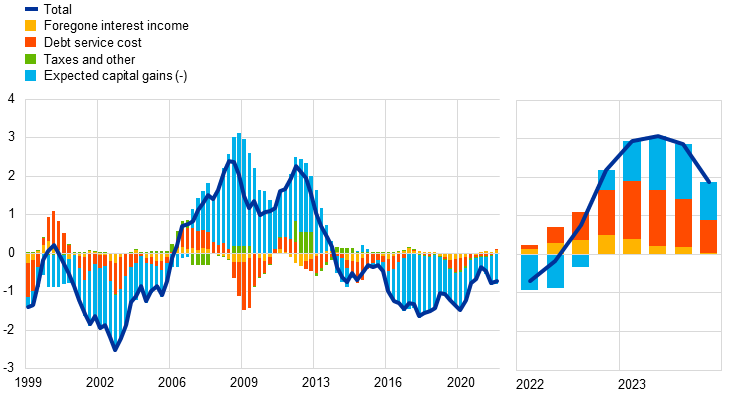
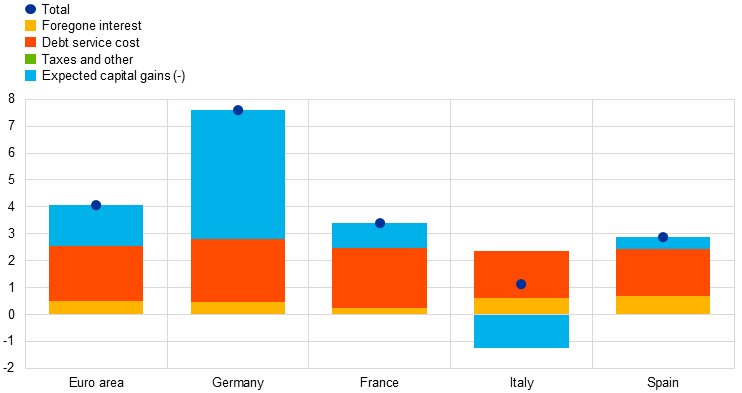
The user cost of housing has risen significantly across the euro area over the last two years, mainly as a result of the higher debt service cost. The user cost of housing has fluctuated considerably in the euro area since 1999, reaching a historic low at the beginning of the global financial crisis in 2007-08 and peaking at the end of the euro area sovereign debt crisis in 2010-12 (Chart A). After the long decline that followed the sovereign debt crisis, the user cost of housing has risen significantly during the recent period of monetary policy tightening. At country level, the increase has been particularly marked in Germany. In terms of drivers, fluctuations in the user cost of housing largely stem from changes in expected capital gains (Chart B, panel a). However, the recent increase has mainly been caused by the rise in the debt service cost, in line with previous episodes of significant changes in monetary policy interest rates. While the increase in the debt service cost is the most important factor in France, Italy and Spain, expected capital losses are more significant in Germany, reflecting the relatively sharp fall in house prices since the start of the recent monetary policy tightening (Chart B, panel b).
Chart B
Drivers of the user cost of housing
a) Changes in the user cost of housing in the euro area
(year-on-year changes, percentage points and percentage point contributions)
b) Recent changes in the user cost of housing in the euro area and its four largest economies
(changes between Q1 2022 and Q4 2023, percentage points and percentage point contributions)
Sources: Barrios et al. (op. cit.), Eurostat, ECB and ECB calculations.
Note: Expected capital gains offset other housing costs and are therefore included in the user cost of housing with a negative sign.
We use an empirical model to relate the level of housing investment to the user cost of housing. A linear regression model links the level of housing investment to the contemporaneous and lagged values of the user cost of housing and the lagged level of the housing stock. The model thus reflects the historical relationship between housing investment and the user cost of housing, where the lagged values of the user cost of housing allow for the gradual response of households to changes in housing costs and the modelling of market frictions, such as a shortage of available land or excessive bureaucracy.[6] If the model prediction matches the actual level of housing investment, changes in housing investment can be linked to changes in the user cost of housing and its underlying drivers. However, if housing investment deviates temporarily from the model prediction, this may be for other reasons and not explicitly modelled. Nonetheless, housing investment should gradually adjust to the value implied by the user cost of housing, as any significant gaps are expected to be corrected over time.[7]
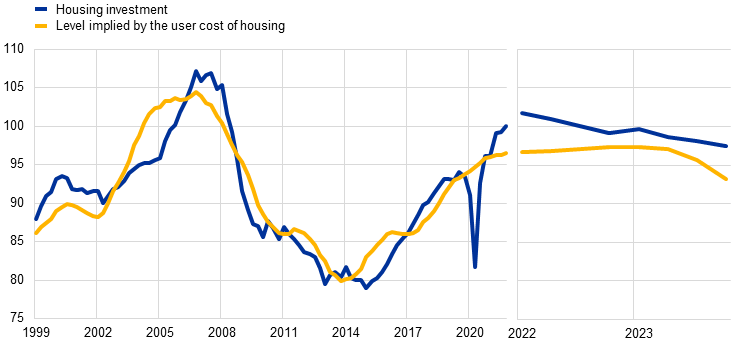
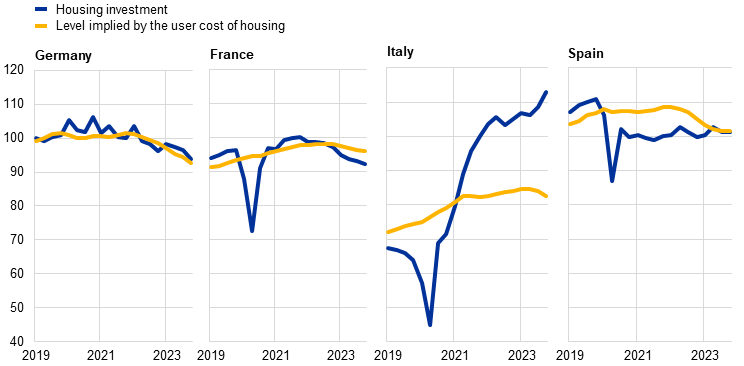
Housing investment in the euro area remained above the level implied by the user cost of housing at the end of 2023, despite the significant decline during 2022-23. According to the results for the euro area, housing investment and the predicted values from the user cost model exhibit a clear positive relationship, confirming that the user cost of housing is an important driver of housing investment (Chart C, panel a). In the period before the global financial crisis, housing investment exceeded the level implied by the user cost of housing and subsequently fell to a level below that suggested by the model, reflecting the boom-and-bust cycle of housing investment during this period.[8] While broadly following the model prediction during the recovery phase after the sovereign debt crisis, housing investment significantly exceeded the level implied by the model in the aftermath of the pandemic, which could have been the result of pandemic-related shifts in household housing preferences.[9] At the end of 2023 housing investment in the euro area was still more than 4% higher than the level predicted by the model, even though it had already fallen significantly. At country level, housing investment in Italy in the fourth quarter of 2023 was significantly higher than the level implied by the model. This was likely a result of the generous tax incentives associated with the “Superbonus”, which boosted housing investment to an all-time high in the fourth quarter of 2023 but is not captured by the user cost (Chart C, panel b).[10] By contrast, housing investment in Germany and Spain in the fourth quarter of 2023 was broadly in line with the model prediction, while in France it was below the predicted level.[11]
Chart C
Housing investment and the level implied by the user cost of housing
a) Housing investment and model predictions for the euro area
(Q4 2021 = 100)
b) Housing investment and model predictions for the four largest euro area economies
(Q4 2021 = 100)
Sources: Barrios et al. (op. cit.), Eurostat, ECB and ECB calculations.
Note: The level implied by the user cost of housing is the level predicted by a linear regression model relating the log level of housing investment to several lagged values of the user cost of housing and the lagged log level of the housing capital stock for the period from the first quarter of 1999 to the fourth quarter of 2023.
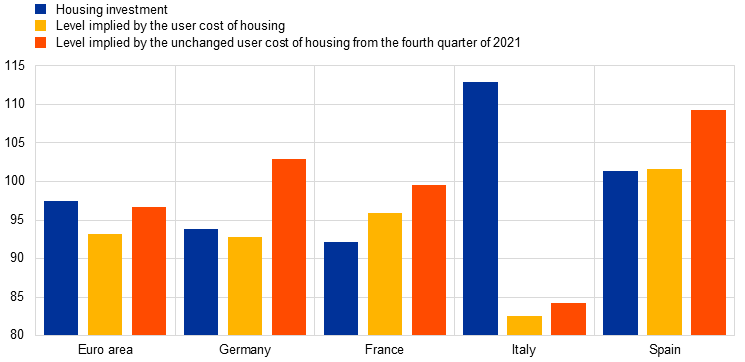
A counterfactual scenario for the user cost of housing illustrates the dampening effects of the recent monetary policy tightening on housing investment. The counterfactual scenario assumes that the user cost of housing remains constant from the fourth quarter of 2021, when the monetary policy tightening cycle began. Thus, the user cost of housing is neither directly affected by the recent monetary policy tightening via interest rates, particularly mortgage rates, nor indirectly affected by the decline in house price growth.[12] According to this counterfactual analysis, housing investment in the euro area would have been about 4% higher at the end of 2023 than the value assumed by the model based on the actual evolution of the user cost of housing (Chart D). In this context, significant differences between countries can be explained either by the magnitude of the change in actual user costs (i.e. in Germany) or the sensitivity of housing investment to changes in the user costs based on past regularities (i.e. in Spain). Overall, the results suggest that the recent monetary policy tightening has had a significant negative impact on the level of housing investment across the euro area from the perspective of the user cost of housing.
Chart D
Counterfactual analysis
(Q4 2021 = 100)
Sources: Barrios et al. (op. cit.), Eurostat, ECB and ECB calculations.
Notes: The level implied by the user cost of housing is the level predicted by a linear regression model relating the log level of housing investment to several lagged values of the user cost of housing and the lagged log value of the housing capital stock. The counterfactual level is the level predicted by the model assuming an unchanged level for the user cost of housing from the fourth quarter of 2021 onwards.
Housing investment in the euro area is likely to weaken further in the near term. Looking ahead, the future development of the user cost of housing is crucial for the outlook for housing investment in the euro area. The fact that housing investment in the euro area was still above the level implied by the user cost of housing at the end of 2023 indicates the possibility of further weakness in housing investment. Moreover, while the debt service cost appears to be stabilising, expected capital gains could fall further owing to their delayed adjustment to past changes, putting additional upward pressure on the user cost of housing.
Legal Disclaimer:
EIN Presswire provides this news content "as is" without warranty of any kind. We do not accept any responsibility or liability for the accuracy, content, images, videos, licenses, completeness, legality, or reliability of the information contained in this article. If you have any complaints or copyright issues related to this article, kindly contact the author above.
