Scentroid's Revolutionary Sensor Information Management Software SIMS3 is Now Live
The intuitive and esthetic graphical interface allows anyone to run complicated data analytics without needing to be an air quality expert.
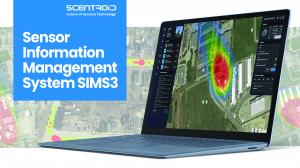
SIMS3 sensor information management software is our all-inclusive software used to view and analyze historical data, run diagnostics, make predictions, and configure various settings for your supported Scentroid device. It offers a complete and integrated suite for ambient air chemical analysis and odour management. SIMS3 can collect data from thousands of devices covering an entire area, using a unique and highly intuitive facility control system.
The Full Experience
SIMS3 revolutionizes air quality monitoring and odour complaint management. The Scentroid team has worked hard to deliver an unforgettable user experience, designed with utmost care to provide you with the tools to determine pollutant threats, air quality alarms, historical data, sampled areas, plumes, complaint management, and much more. The intuitive and esthetic graphical interface allows anyone to run complicated data analytics without needing to be an air quality expert.
SIMS3 Features
Facility Organization
All facilities are separately organized so that the users of each will only see data from their own units. Regulators will have an overall view of all facilities within their monitoring scope.
Odour Complaint Management
Odour complaints are automatically analyzed to determine the individual validity of each against a known odour source or event. They’re then visually marked as justified (red), not justified (green), and to be justified (yellow). For each complaint, the user will receive a list of all contributing sources and events. Complaints with no known sources will be analyzed to determine the validity and to identify possible locations of the unknown contributing source.
SIMS3 AI
AI compares estimated odour levels from dispersion modelling to the actual measurements collected with odour monitoring equipment. AI adjusts and updates the emission rates of all sources to compensate. Ground-level readings are used by SIMS3 to conduct back trajectory to identify unknown sources. Continuous pollution data and field olfactometric data are used with meteorological data to triangulate the exact location of an odour source.
Weather and Complaint Forecasting
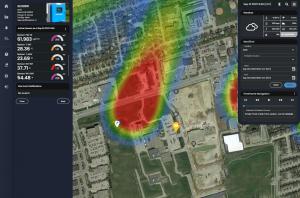
The built-in weather forecasting module allows the user to see any future weather events, determine complaint risk probability, view temperature, and more. Complaint risks are displayed underneath each individual forecast, whether daily or hourly, to assess the potential of receiving an odour complaint at that time, or for that date. Clicking on any date within the forecasted period will let the user generate a plume based on changing weather patterns, along with a complaint risk probability rating.
Event and Notification Log
The SIMS3 Event Log contains event data, timeframe, justification, occurrences, intensity, and a brief description. At a glance, users can determine the most logged event types, determine the weekly frequency of logged events, and track the most active day, most active time, and total events registered. A series of filters allow users to quickly find a specific event, notification, event type, new or read status, event time, justification status, occurrences, intensity, and more.
Notifications
We understand that you may not always have access to your computer to view in-app notifications on sensor alarms and alerts. Should you be monitoring a potential air quality hazard, an immediate notification may be necessary. Scentroid has you covered! Our SIMS3 platform is capable of notifying you via SMS or email should any sensors report an exceedance of a pre-determined value within our alarm settings page.
Timeline Control and Navigation
A powerful component of SIMS3 is total control of time. Users can move a Timeline Navigation Slider to investigate how a Plume evolves over a set period. Plume data readings from ambient monitors, complaints, source emissions, and all other events will all be synced with the selected time. Users can even create an animation to visualize how the plumes and complaints evolve, as plumes will develop and change based on weather conditions, submitted user data, and algorithmic AI developments.
Users can also move the timeline into the future and see SIMS3’s predictions for plumes, complaints, and even sensor readings within the next 2 days.
SIMS3 Analytics
View data in several formats including temporal view, statistical view, AQI Analysis view, and heat map.
Temporal Mode
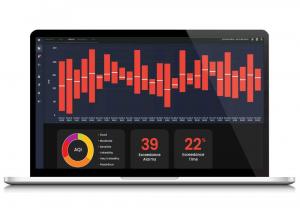
As shown here in temporal view, the user can Isolate or compare collected sensor data for any user-defined timeframe in an easy-to-read chart. Any event or event type that occurred within the specified timeframe is also tracked.
Statistical Mode
Isolate and determine individual sensor reading trends with our detailed statistical analysis view. Data is presented as percentages vs concentration for quick reference. A data trend guide displays whether your tracked chemical readings are displaying an increase or decrease.
AQI Analysis
Based on established AQI Thresholds (either automatically generated or user-defined), view recorded AQI for any period of time. This module will also allow you to view how many times AQI exceeded these thresholds, and for how long (percentage).
Heat Map
View each individual sensor’s heat map within a user-defined period. Concentration is presented in this format to assist the user with visually defining patterns and trends. Heat map data is presented as date vs. time.
Event Analytics
Take your analytic capabilities even further by analyzing your recorded events, event types, and overall event activity. In this module, you will be able to determine your most triggered event type and the days with the highest recorded activity.
Odor Complaint Analytics
This module allows you to easily determine the justification analytics of all recorded odour events. View which days have had the highest justified or not justified events, view the correlation matrix with contributing events and see which processes may have a connection to all recorded odour complaints.
Export Reports
The SIMS3 reporting module provides you with the tools you need to make informed decisions regarding your monitoring projects. At the click of a button, this document generates averages as well as thorough individual sensor reports. Users can schedule weekly, monthly, or annual reports emailed directly to them once generated!
Matthew Cabral
Scentroid
+1 6472080488
scentroid.social@gmail.com
Visit us on social media:
Facebook
Twitter
LinkedIn
Presenting SIMS3: Scentroid's Sensor Information Management Software Solution
Legal Disclaimer:
EIN Presswire provides this news content "as is" without warranty of any kind. We do not accept any responsibility or liability for the accuracy, content, images, videos, licenses, completeness, legality, or reliability of the information contained in this article. If you have any complaints or copyright issues related to this article, kindly contact the author above.


