DAT: Truckload Volumes Hit 5-Year High in October
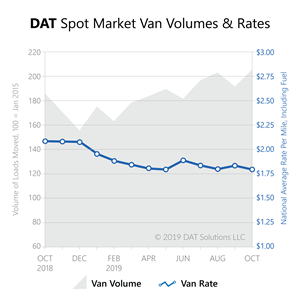
PORTLAND, Ore., Nov. 08, 2019 (GLOBE NEWSWIRE) -- October saw more spot market truckload shipments than any other month since January 2015, according to the DAT Truckload Volume Index, which reflects changes in the actual number of spot market loads moved each month. While volumes continued to climb for dry van, refrigerated (“reefer”) and flatbed freight, truckload rates have not kept pace.
There was plenty of capacity to handle the increased volume, so truckload rates fell in October compared to August. A rush of demand in the final few days of the month created momentum for higher prices in November, though.
“Shippers were active in advance of the holidays,” said Peggy Dorf, Market Analyst with DAT Solutions. “And the low rates are effectively attracting more volume from contract carriers to spot transportation providers, especially during the busy season.”
Van rates averaged $1.80 per mile in October, including fuel. That was a 5-cents drop compared to the prior month, and 28 cents below the October 2018 average. Volume was up 7.3 percent compared to September.
Apple and other fall harvests led to a peak in reefer traffic in October, with a 9.2 percent increase month over month. The average rate was $2.12 per mile, 4 cents lower than the September average and 30 cents lower than October 2018.
Flatbeds moved 3.4 percent more loads in October compared to September, but fell just short of August’s peak demand. Flatbed rates averaged $2.27 per mile, down 3 cents from September and a 20-cent drop from October 2018.
“At this time last year, spot rates began to recede from record-high pricing,” Dorf added. “So year-over-year comparisons should become more favorable – or at least less negative – through the remainder of this year and into Q1.”
About the DAT Truckload Freight Volume Index
The DAT Truckload Freight Volume Index reflects the change in the number of loads with a pickup date during that month; the actual index number is normalized each month to accommodate any new data sources without distortion. Baseline of 100 equals the number of loads moved in January 2015, as recorded in DAT RateView, a database of rates paid on an average of 3 million loads per month. DAT national average spot rates are derived from RateView and include only over-the-road lanes with lengths of haul of 250 miles or more. Spot rates represent the payments made by freight brokers and 3PL to the carriers.
About DAT
DAT market trends and data insights are derived from 256 million annual freight matches and a database of $65 billion in annual market transactions. Related services include a comprehensive directory of companies with business history, credit, safety, insurance, and company reviews; broker transportation management software; authority, fuel tax, mileage, vehicle licensing, and registration services; and carrier onboarding.
Founded in 1978, DAT Solutions LLC is a wholly owned subsidiary of Roper Technologies (NYSE:ROP), a diversified technology company and constituent of the S&P 500, Fortune 1000, and Russell 1000 indices. www.DAT.com
Media Contact
Eileen Hart, Vice President, Marketing & Corporate Communications
DAT Solutions
eileen.hart@dat.com
503-672-5132
A photo accompanying this announcement is available at https://www.globenewswire.com/NewsRoom/AttachmentNg/e3406d10-0b82-403c-944a-2bb023af3c35
Legal Disclaimer:
EIN Presswire provides this news content "as is" without warranty of any kind. We do not accept any responsibility or liability for the accuracy, content, images, videos, licenses, completeness, legality, or reliability of the information contained in this article. If you have any complaints or copyright issues related to this article, kindly contact the author above.


