How to Prevent Injuries at a Manufacturing Facility
What are the leading causes of injuries in a facility and how do you prevent them? Read the leading preventative tips!
So what can employers and safety managers do to promote injury prevention and reduce workers’ compensation costs?”
AUSTIN, TEXAS, UNITED STATES, June 14, 2016 /EINPresswire.com/ -- If you are responsible for worker health and safety in a manufacturing work environment, you know that injury prevention at work is a serious business. We’ll take a look at the latest occupational research on the top causes of workplace injuries. We’ll also identify practical workplace safety tips that can help keep your workers healthy and productive – while limiting your exposure to workers compensation claims.— Formaspace
What’s the cost of non-fatal workplace accidents in lost income and productivity?
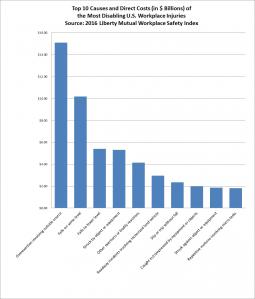
According to the 2016 Liberty Mutual Workplace Safety Index, the most serious non-fatal disabling workplace injuries cost nearly $62 billion in direct U.S. workers compensation claims.
That figure is quite sobering.
It’s nearly as high as the estimate for lower back pain — over $85 billion* – calculated by Stanford University researchers.
(*This estimate is for both work and non-work based injuries)
Which are the most injury prone Manufacturing industries?
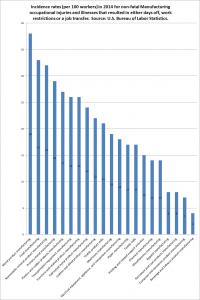
The Bureau of Labor Statistics (BLS) keeps track of different rates of manufacturing accidents within 21 different manufacturing sub-categories, ranging from primary metal manufacturing to plastics and rubber products manufacturing.
Looking at the chart we created from the BLS’s 2014 data, it’s clear that wood product manufacturing has the highest rate of non-fatal occupational injuries and illnesses*.
(*We are counting non-fatal injuries that resulted in employee days off, employee work restrictions or employee job transfer.)
Food manufacturing and nonmetallic mineral product manufacturing are ranked as second and third most dangerous respectively. Surprisingly, petroleum and coal products manufacturing have the third ‘safest’ rate of accidents in BLS’ records (again this is for non-fatal accidents). Computer and electronic product manufacturing had the second lowest accident incident rate.
Can you guess which industry sector had the lowest rate for non-fatal accidents? It is beverage and tobacco product manufacturing.
Which manufacturing industry sectors have the highest and the lowest absolute number of accidents?
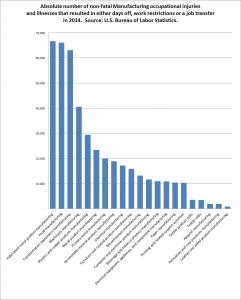
Now let’s take a quick look at which manufacturing industry sectors ranked in terms of an absolute number of non-fatal accidents. (Naturally this number will vary from the rate because of the different sized industry sectors.)
In absolute terms, fabricated metal product manufacturing had the largest number — 66,100 — of non-fatal injuries that resulted in employee days off, work restrictions or job transfers.
Food manufacturing was again ranked number two, with 66,100 accidents.
At the other end of the scale, the safest sector for non-fatal injuries was leather and allied product manufacturing, with just 900 non-fatal accidents.
What are the leading causes of injuries in the workplace?
Now let’s take a closer look at occupational research from the 2016 Liberty Mutual Workplace Safety Index.
(Note: These figures cover all workplaces, not just manufacturing facilities.)
Here is how Liberty Mutual ranks workplace injuries, in descending order of occurrence:
Overexertion involving outside source
Falls on the same level
Falls to lower level
Struck by object or equipment
Other exertions or bodily reactions
Roadway incidents involving motorized land vehicle
Repetitive motions involving micro-tasks
Struck by object or equipment
Caught in/compressed by equipment or objects
Slip or trip without fall
When we chart the cost of these accidents, the order changes slightly as some injury categories incur higher health care and worker compensation costs.
Practical workplace safety tips that can help you keep your workers healthy and productive.
So what can employers and safety managers do to promote injury prevention and reduce workers’ compensation costs?
We’ll start with the same top 10 injuries from Liberty Mutual above, but this time group them into three categories:
Overexertion (including Repetitive Motion Stress)
STF (Slips, Trips, and Falls)
Equipment and Roadway Accidents.
Then we’ll offer practical workplace safety tips in each category that can help you keep your workers healthy and productive.
Tips for Overexertion Injury Prevention, including Repetitive Motion Stress
Read more... https://formaspace.com/articles/manufacturing/prevent-injuries-manufacturing-facility/?utm_source=einpresswire&utm_medium=content&utm_campaign=article-061416
Mehmet Atesoglu
Formaspace
8002511505
email us here
Legal Disclaimer:
EIN Presswire provides this news content "as is" without warranty of any kind. We do not accept any responsibility or liability for the accuracy, content, images, videos, licenses, completeness, legality, or reliability of the information contained in this article. If you have any complaints or copyright issues related to this article, kindly contact the author above.


