
Does Compensation Actually Paid Align with Total Shareholder Return?
Key Takeaways
- There is a strong correlation (.56) between relative TSR and CAP but not between TSR and SCT Compensation (.08)
- A relative rank analysis against a company’s peer group or industry- and size-specific index provides the most useful evaluation of the relationship between CAP and company TSR
- A disconnect between relative CAP and TSR may be traceable to competitive deficits/ surpluses in executive compensation strategy and policies, which may need to be addressed
In 2023, Pay Governance research concluded that the information afforded by the new pay versus performance (PVP) disclosures could be reasonably used to assess the alignment of pay and performance, using Compensation Actually Paid (CAP) and relative total shareholder return (TSR) (see our prior post, Utilizing Compensation Actually Paid to Evaluate Pay and Performance). Performing such an analysis on a relative basis against a comparable set of companies showed that compensation and performance are strongly aligned for a majority of companies. This is primarily due to the large portion of executive compensation delivered in equity and the “mark-to market” annual adjustment methodology for equity incentives.
We also concluded that Summary Compensation Table Total Compensation (SCT Compensation) is not useful or valid to test such alignment.
Last year, only 3 years of information were required in the disclosure, with expansion of the measurement period to 5 years over the subsequent 2 years. The addition of a fourth year of data increases the robustness of this pay for performance analysis, which is based on Pay Governance’s review of the recent PVP disclosures of 159 S&P 500 companies with filings available as of May 31, 2024.
Various organizations and articles have utilized the newly required PVP disclosures in different ways, but most concluded that CAP and TSR are aligned. In addition, one of the major proxy advisory firms has begun to incorporate the PVP disclosure in its pay for performance analyses beginning in 2024, while the other major proxy advisory firm may do so on a selective basis to confirm its own pay for performance methodology
Establishing the Approach: Using 2024 PVP Disclosures to Determine Level of Pay and Performance Alignment
To demonstrate how to analyze pay and performance using the PVP disclosures, we used a similar approach as last year by comparing a company’s percentile ranking of cumulative CAP and cumulative TSR against companies in their 2-digit GICS® Sector using the 4-year period from 2020 to 2023 to minimize the impact of outliers, transitions, and other CAP anomalies. As the sample includes only S&P 500 companies, there is an inherently reasonable size to compare against as well.
Assessing the relative positioning of CAP and TSR performance using percentile rankings against a relevant peer or industry group demonstrates if a particular company’s pay and performance alignment is commensurate with, better, or worse than peers. This type of relative analysis is consistent with how Pay Governance typically evaluates Realizable Pay and performance alignment for our clients.
Analysis
SCT Compensation Using 2024 Proxies
Figure 1 below plots each of the 159 S&P 500 companies based on the difference in their respective percentile ranking of 4-year cumulative TSR and 4-year cumulative SCT Compensation. The three-shaded areas represent companies where relative TSR performance ranking and SCT Compensation percentile ranking are within 25 percentile points (green zone), TSR percentile ranking exceeds SCT Compensation ranking by >25 percentile points (yellow zone), and TSR percentile ranking is below SCT Compensation ranking by >25 percentile points (red zone).
- The correlation between TSR rank and SCT Compensation rank is very low (0.08) and the same as last year’s findings. This is a strong indication that using SCT Compensation for evaluating pay for performance has limited statistical and governance utility because it does not consider the change in the value of the equity or performance outcomes or estimates after the grant date
- As shown, 48% of the companies have a TSR rank that is within ±25 percentile points of the SCT Compensation rank (green zone), compared to 43% last year. While this might suggest a significant minority of companies have aligned SCT pay and performance, the low correlation noted above would indicate this outcome is random, rather than an indication of alignment
- The remaining 52% of the companies fall in the yellow or red zones, where the TSR rank either exceeds or is lower than the SCT Compensation rank by >25 percentile points, which potentially signals a possible disconnect between pay and performance or is just another random outcome
Figure 1: Relative 4-year Cumulative SCT Compensation versus 4-year Cumulative TSR (N=159 S&P 500 Companies)[1]

Compensation Actually Paid
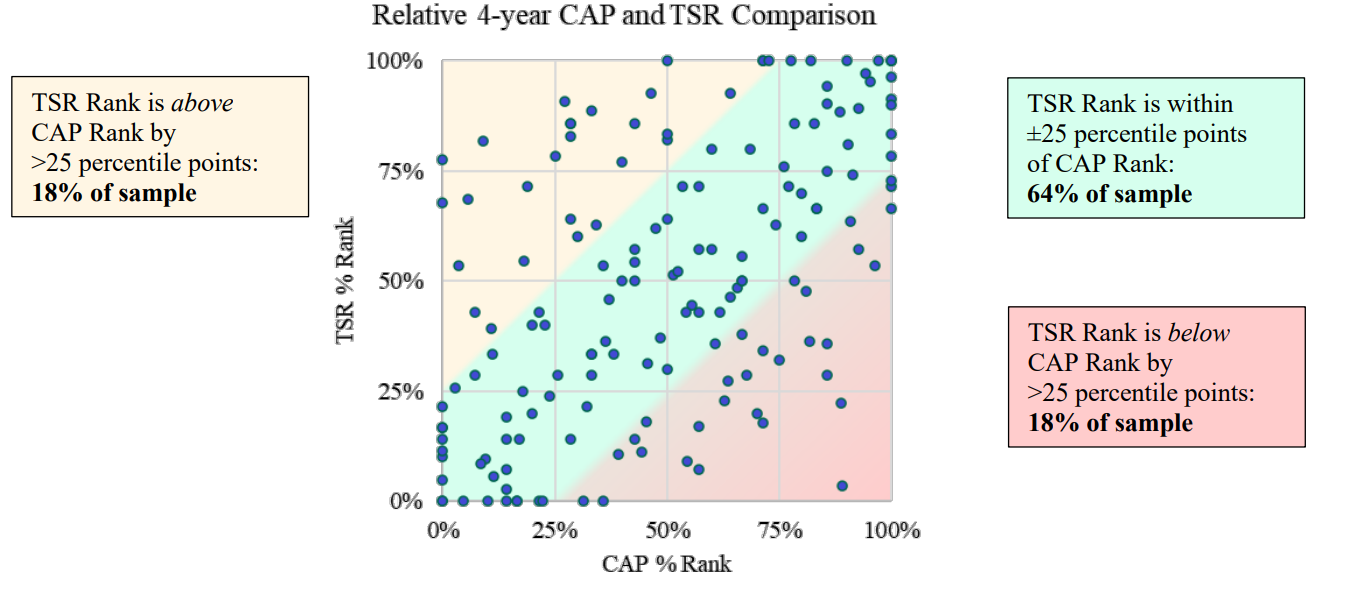
When the same analysis is performed using CAP rather than SCT Compensation, the alignment of pay and performance improves dramatically as reported in prior Viewpoints and as shown in Figure 2 below.
- Correlation between TSR rank and CAP rank is high (0.56) and similar to last year (.54)
- For further confirmation of alignment, we also found strong correlation (.52) for a relative analysis of the entire sample (rather than industry-specific comparisons)
- The percentage of companies in the green zone increases from 48% to 64%
Figure 2: Relative 4-year Cumulative CAP versus 4-year Cumulative TSR (N=159 S&P 500 Companies)[1]
Disclosure Changes for 2024
Going into the 2024 proxy season, we anticipated that only a few companies would make changes to their disclosures other than the addition of another year of new data. Much effort and thought went into deciding the Company-Selected Measure, TSR comparison group, and the list of Important Financial Metrics last year; those decisions proved to be durable for this year and likely future years, barring a large incentive program change. Below is a summary of disclosure observations for this year compared to last year:
- 96% of companies used the same Company-Selected Measure as last year
- 86% of companies used the same peer group or index as last year for TSR comparisons. Not surprisingly, the large majority of those companies that had a different peer group were those using custom peer groups whose constituents changed from last year
- 87% of companies had the same number of Important Financial Metrics as last year, 7% had fewer metrics, and 6% had more metrics
- Of those that had the same number of metrics, 93% used the exact same metrics, with only 7% changing their metrics between years
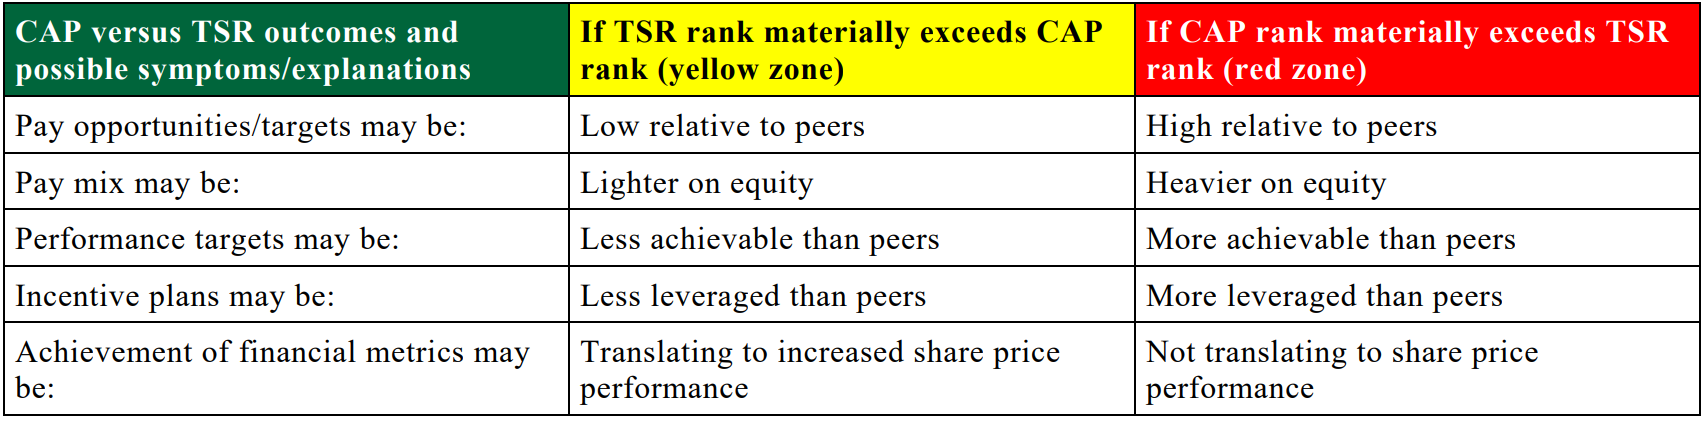
Relative PVP Implications and Considerations
Compensation Committees and management may find that using a relative analysis of cumulative CAP and TSR against a company’s peer group or industry sector can provide a meaningful evaluation of pay and performance, the results of which may help improve compensation programs. Companies in the green zone, where relative CAP rank is commensurate with TSR rank, indicates that compensation outcomes are consistent with the shareholder experience, and diligent monitoring remains essential to ensure continued alignment. For companies in the yellow or red zones, there may be several program design features that might be worth examining to improve alignment, including:
Conclusion
The second year of the SEC’s new PVP disclosure reinforced the pay for performance implications cited in last year’s research: CAP is strongly aligned with TSR and is far better than SCT Compensation for measuring pay for performance. In addition, companies appear to have “locked-in” the disclosure for their Company Selected Measure, TSR Peer Group, and 3-7 Most Important Performance Measures.
1This study includes data provided to us by ESGAUGE of 189 S&P 500 companies that filed PVP disclosures as of May 31, 2024. The sample was divided into 11 industry sectors.(go back)
